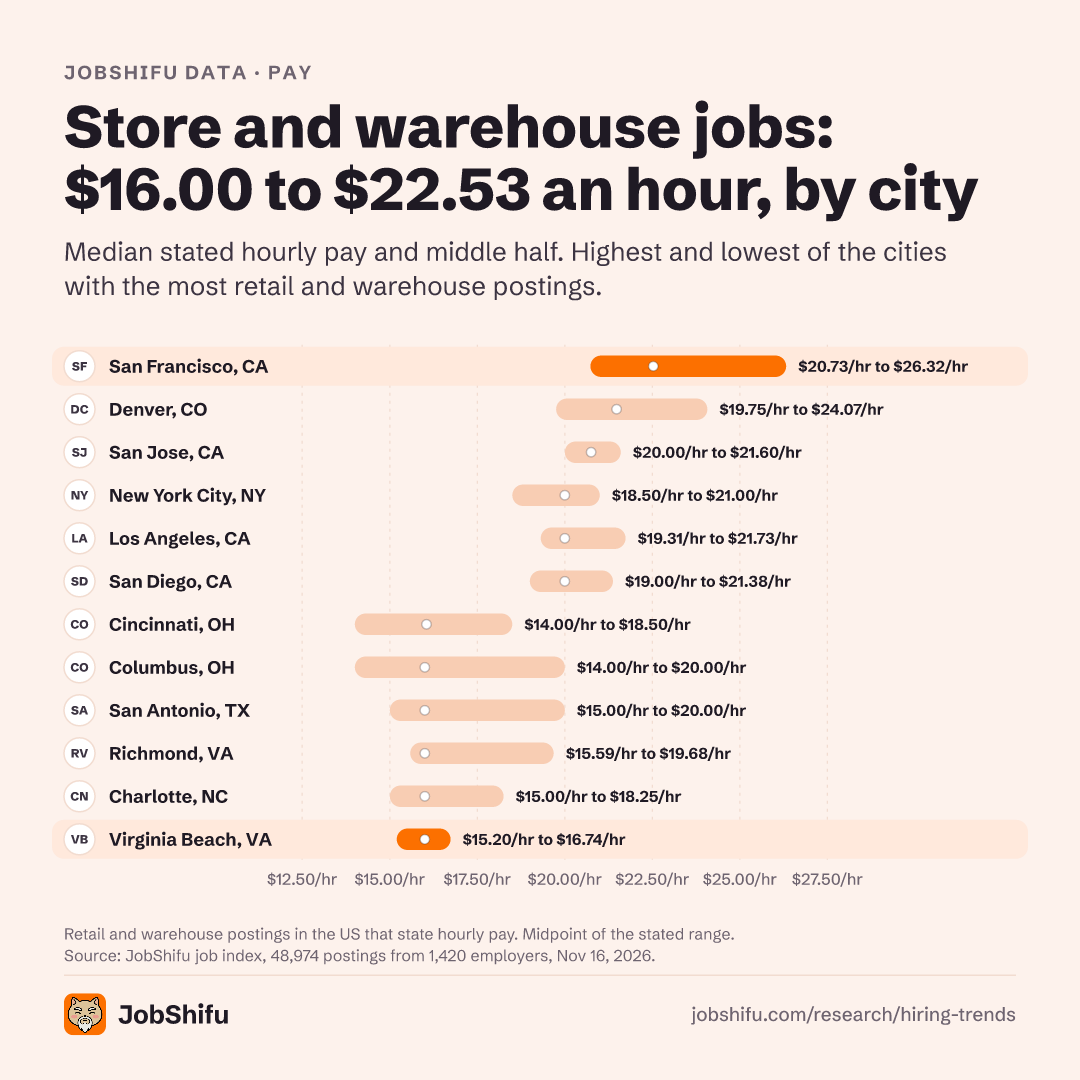
If you work in a store or a warehouse, the pay you are offered depends on where you live, and also on which posting you pick. Across 48,974 open US retail and warehouse postings that state hourly pay, from 1,420 employers, the median runs from $16.00 an hour in Columbus, OH, San Antonio, TX, Richmond, VA, Charlotte, NC and Virginia Beach, VA to $22.53/hr in San Francisco, CA: the top city states 1.4 times the bottom one. The more useful finding is inside each city. In Columbus and San Antonio, one posting in four states $20.00 an hour or more, the same as the median in New York City.
The highest and lowest paying cities
Among the cities with the most store and warehouse postings, six state a median of $20.00 an hour or more: San Francisco, CA ($22.53/hr), Denver, CO ($21.48/hr), San Jose, CA ($20.75/hr), and New York City, NY, Los Angeles, CA and San Diego, CA (each $20.00/hr). Six state about $16.00/hr: Cincinnati, OH ($16.05/hr), and Columbus, OH, San Antonio, TX, Richmond, VA, Charlotte, NC and Virginia Beach, VA (each $16.00/hr).
The spread inside a city
The bars show the middle half of postings in each city, the range between the lowest quarter and the highest quarter. In Columbus, OH that runs from $14.00/hr to $20.00/hr. In San Antonio, TX it runs from $15.00/hr to $20.00/hr, and in Richmond, VA from $15.59/hr to $19.68/hr. So in these $16.00/hr cities, the better-paying quarter of postings states about what a typical posting states in New York City, Los Angeles or San Diego.
Not every city works that way. In Virginia Beach, VA the middle half is tight, $15.20/hr to $16.74/hr, and in San Jose, CA it runs from $20.00/hr to $21.60/hr. Where the range is narrow, most postings state close to the same pay.
What to do with this
- Look past the first posting. In a city like Columbus or San Antonio, the gap between the lower and upper quarter of postings is nearly as wide as the gap between the lowest and highest paying cities.
- Use the stated pay to sort your list. When a posting states an hourly figure, rank it by that figure before you apply instead of finding out at the interview.
- Know your city's range. If a posting in your city states less than the bottom of the middle half, you are looking at one of the lowest-paying quarter of jobs there.
- Do not move for pay alone. The top city states 1.4 times the bottom one, while the spread inside a single city can be nearly as large.
The bottom line
Where you live sets a baseline for store and warehouse pay, but which posting you pick can move it almost as much. In Columbus and San Antonio, two of the cities that pay least, one posting in four still states $20.00 an hour or more. Read the stated pay, rank your options by it, and apply to the top of your city's range first. Software engineer pay shows a similar pattern: see software engineer pay by employer and city.
How this was measured
Retail and warehouse postings in the US that state hourly pay, open on November 16, 2026. Each posting is counted at the midpoint of its stated range; the dot is the median and the bar is the middle half, by the posting's city. The chart shows the highest and lowest paying of the cities with the most of these postings. Postings that state yearly pay, or no pay, are not in the sample.
Source: JobShifu job index, 48,974 postings from 1,420 employers, open on November 16, 2026. More of our data is on the hiring trends dataset page.
← All posts